NYC Metro Population Maps
Where in the region was growth concentrated?
Between 2000 and 2010, the region's population change was concentrated in the region's core, as well as in in outer counties such as Suffolk in NY, New Haven in CT, and Ocean and Middlesex counties in NJ. Only Essex county saw a decrease in its share of population, while outer regions captured a small percentage of the population growth of the entire region.
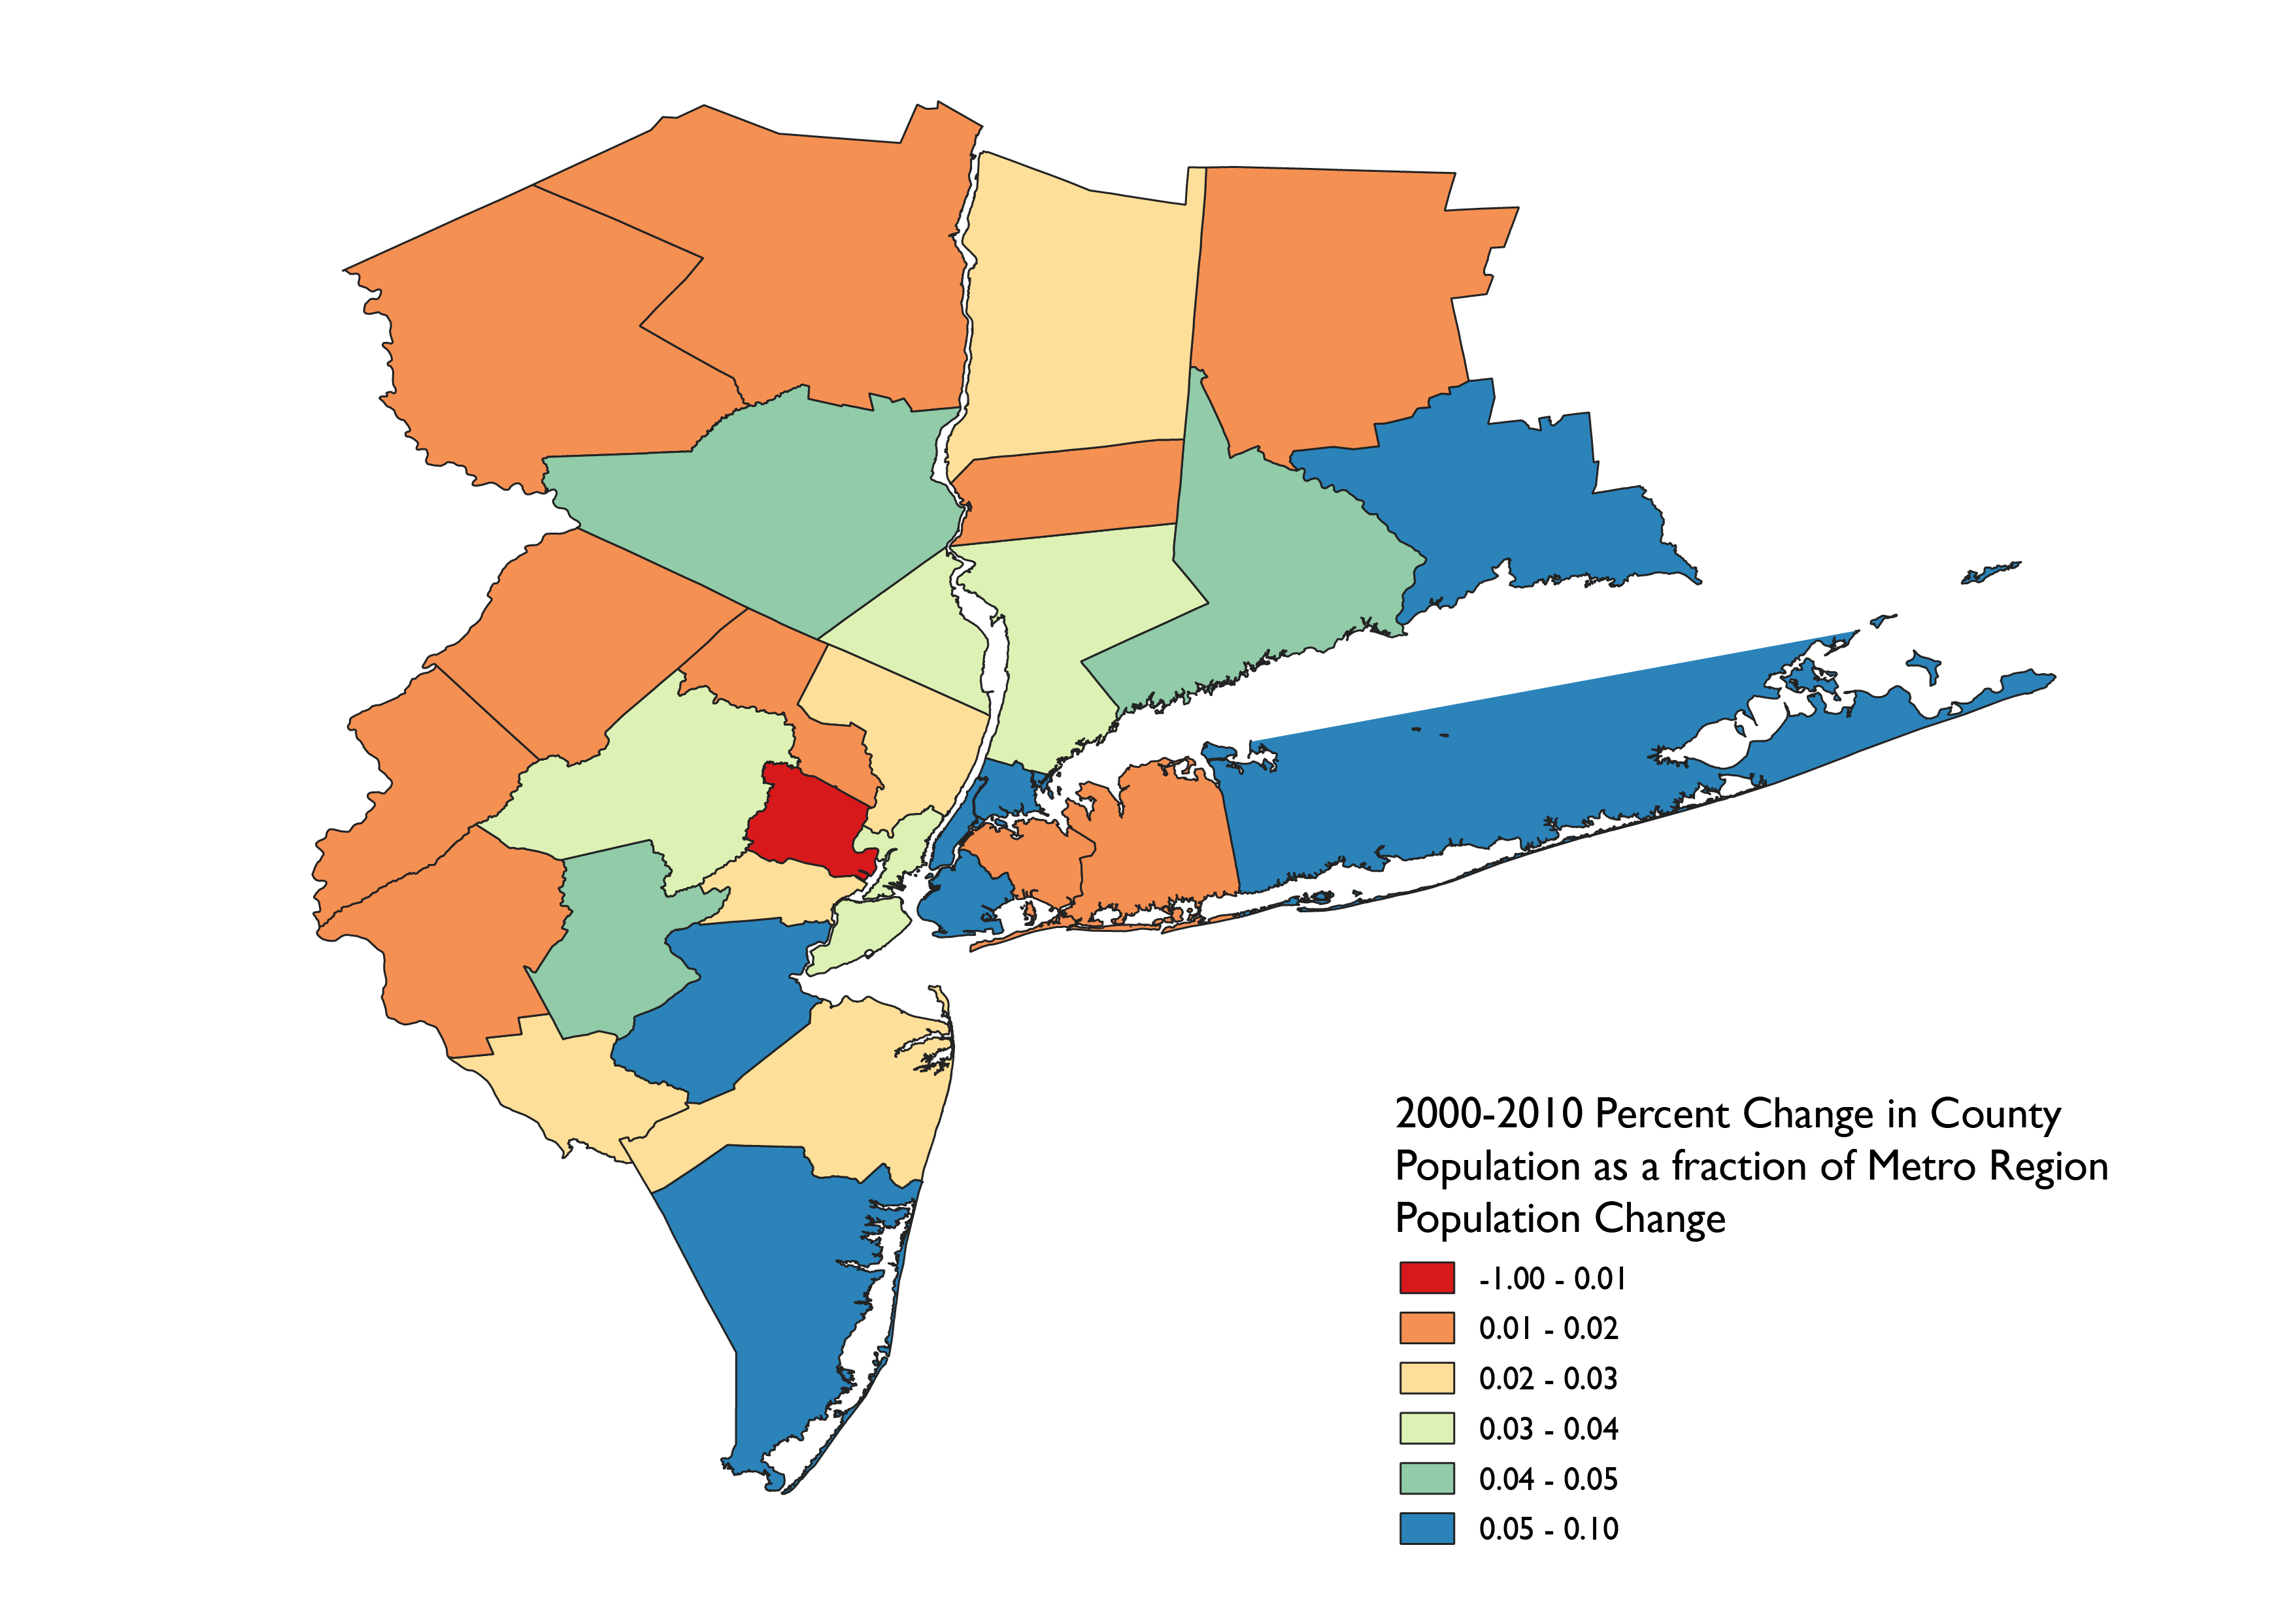
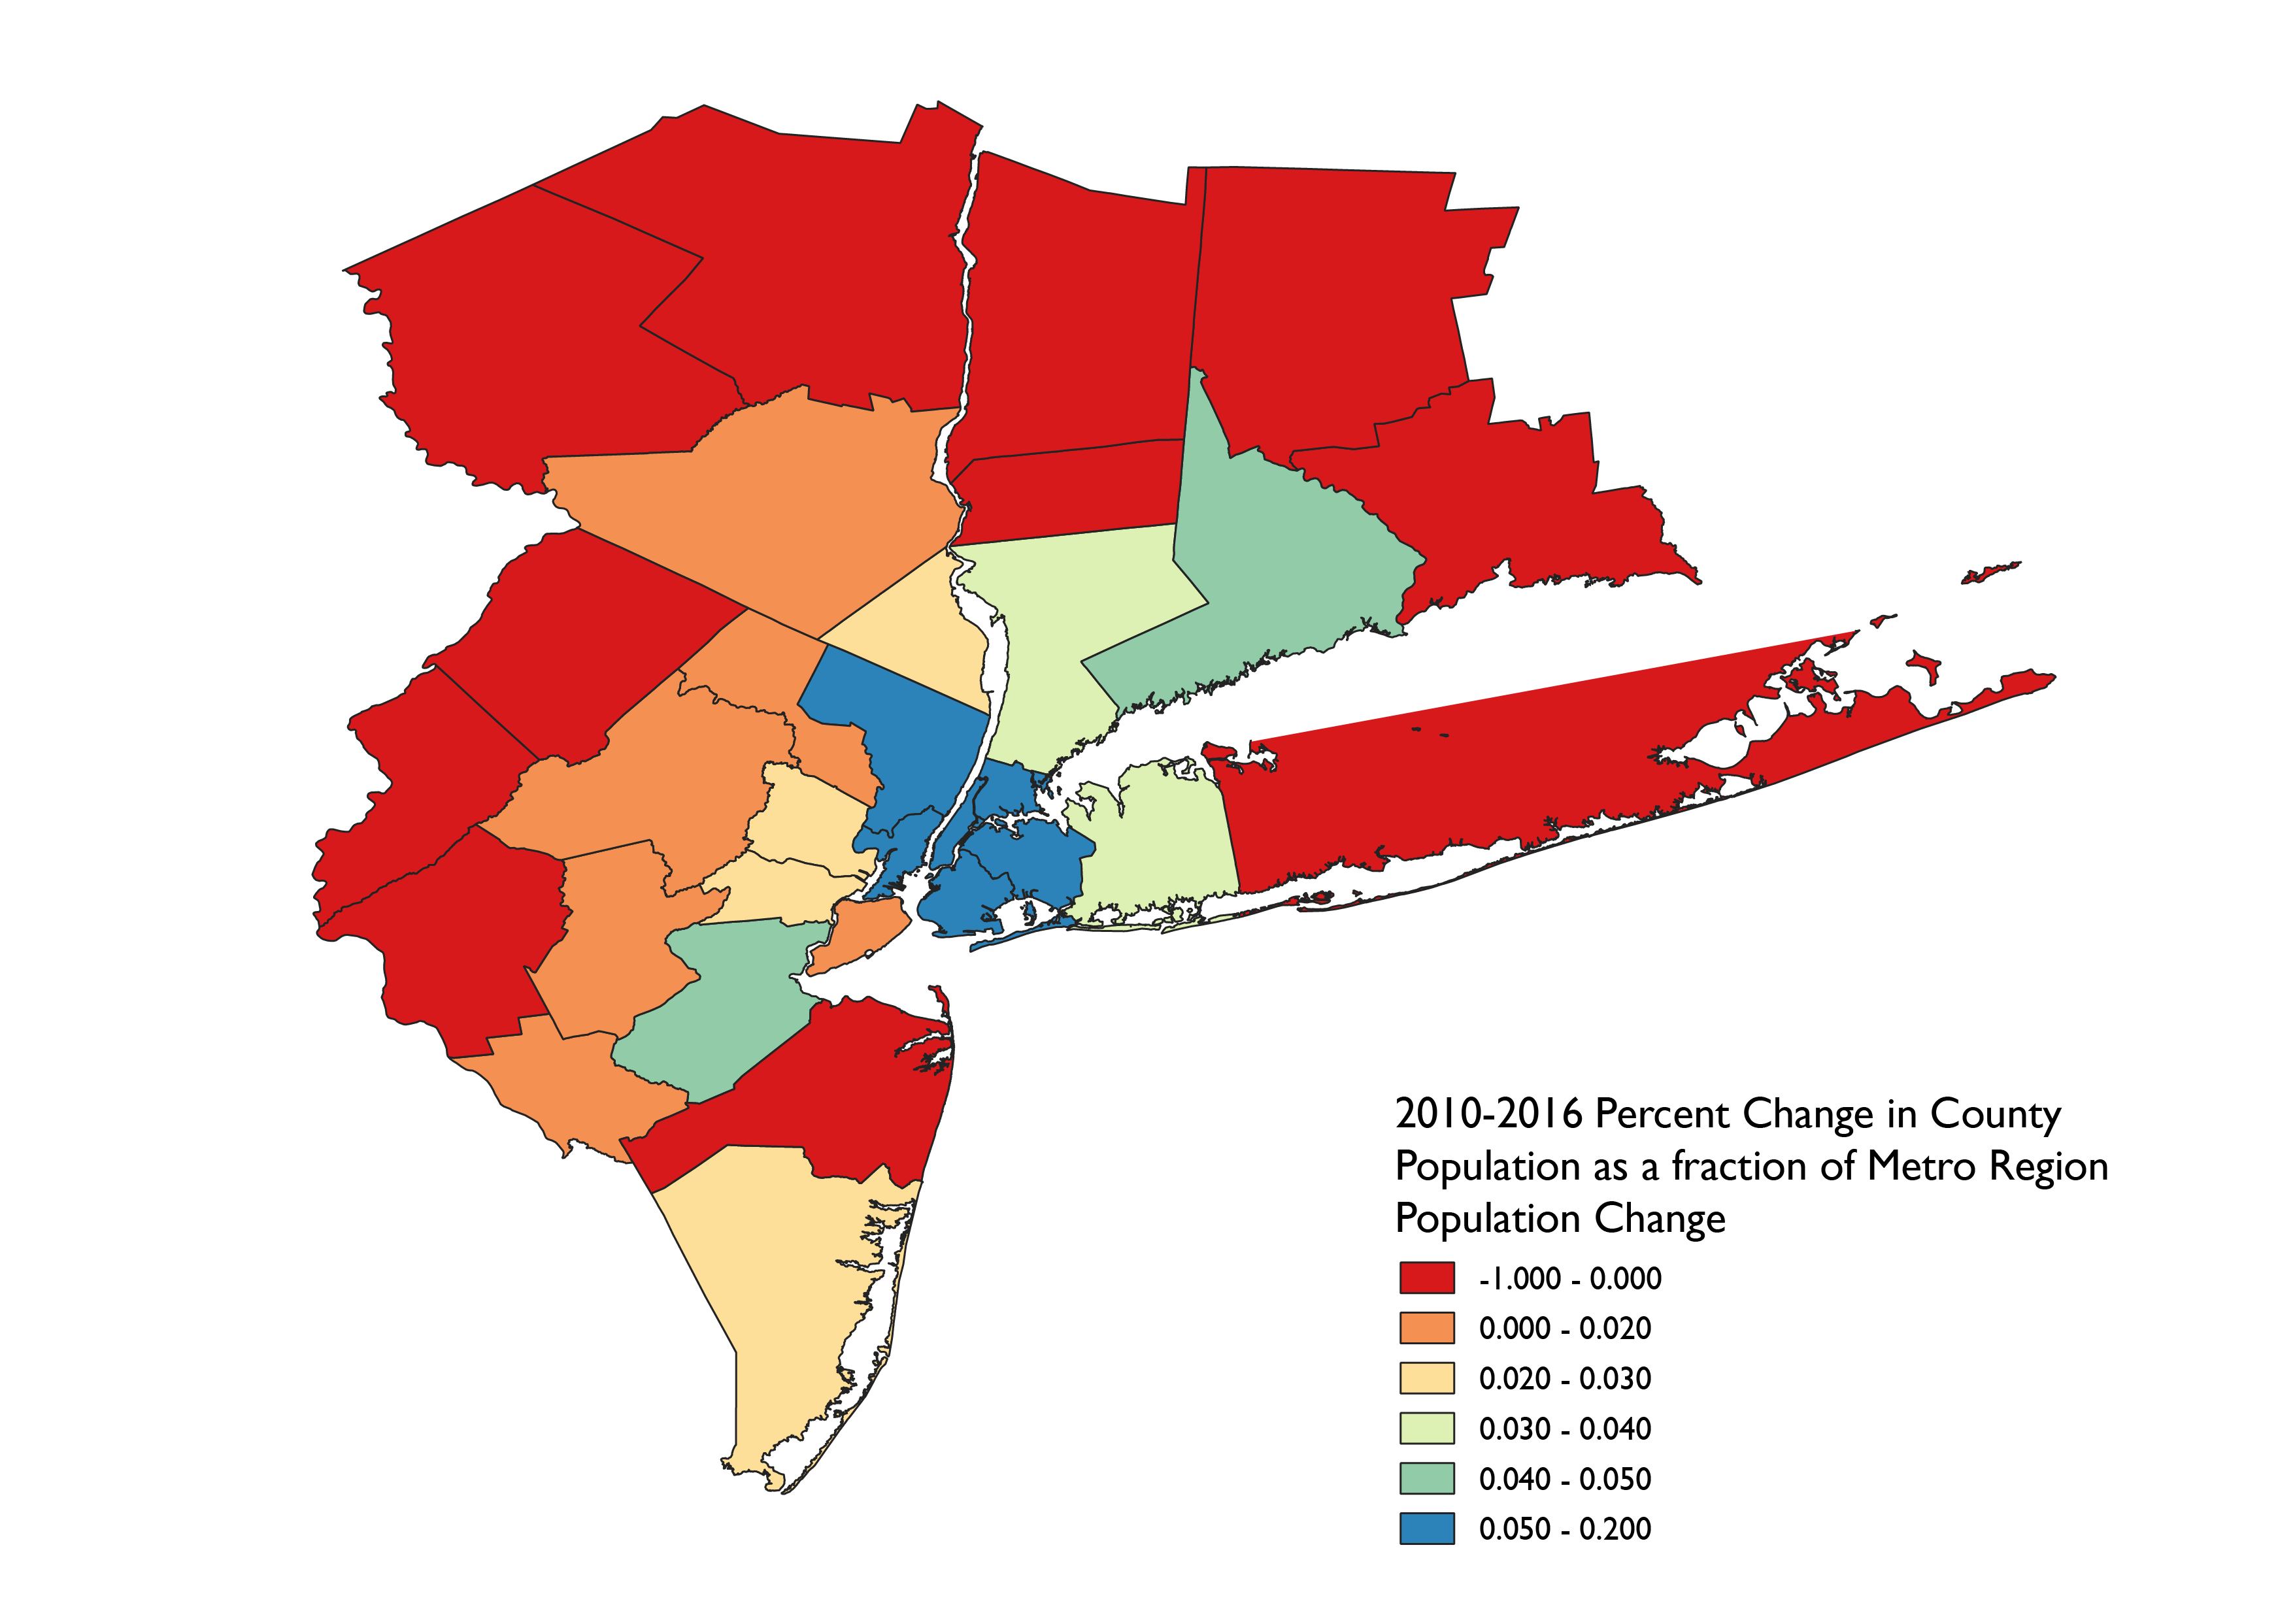
The region's core again captured most of the metro's population increase between 2010 and 2016. During this period, however, the outer counties in the region largely accounted for all population decreases in the region.
When did each county experience most growth?
The core of the NYC metro region experienced most of its growth after 2010, whereas the outer parts of the region had greater population change between 2000 and 2010.
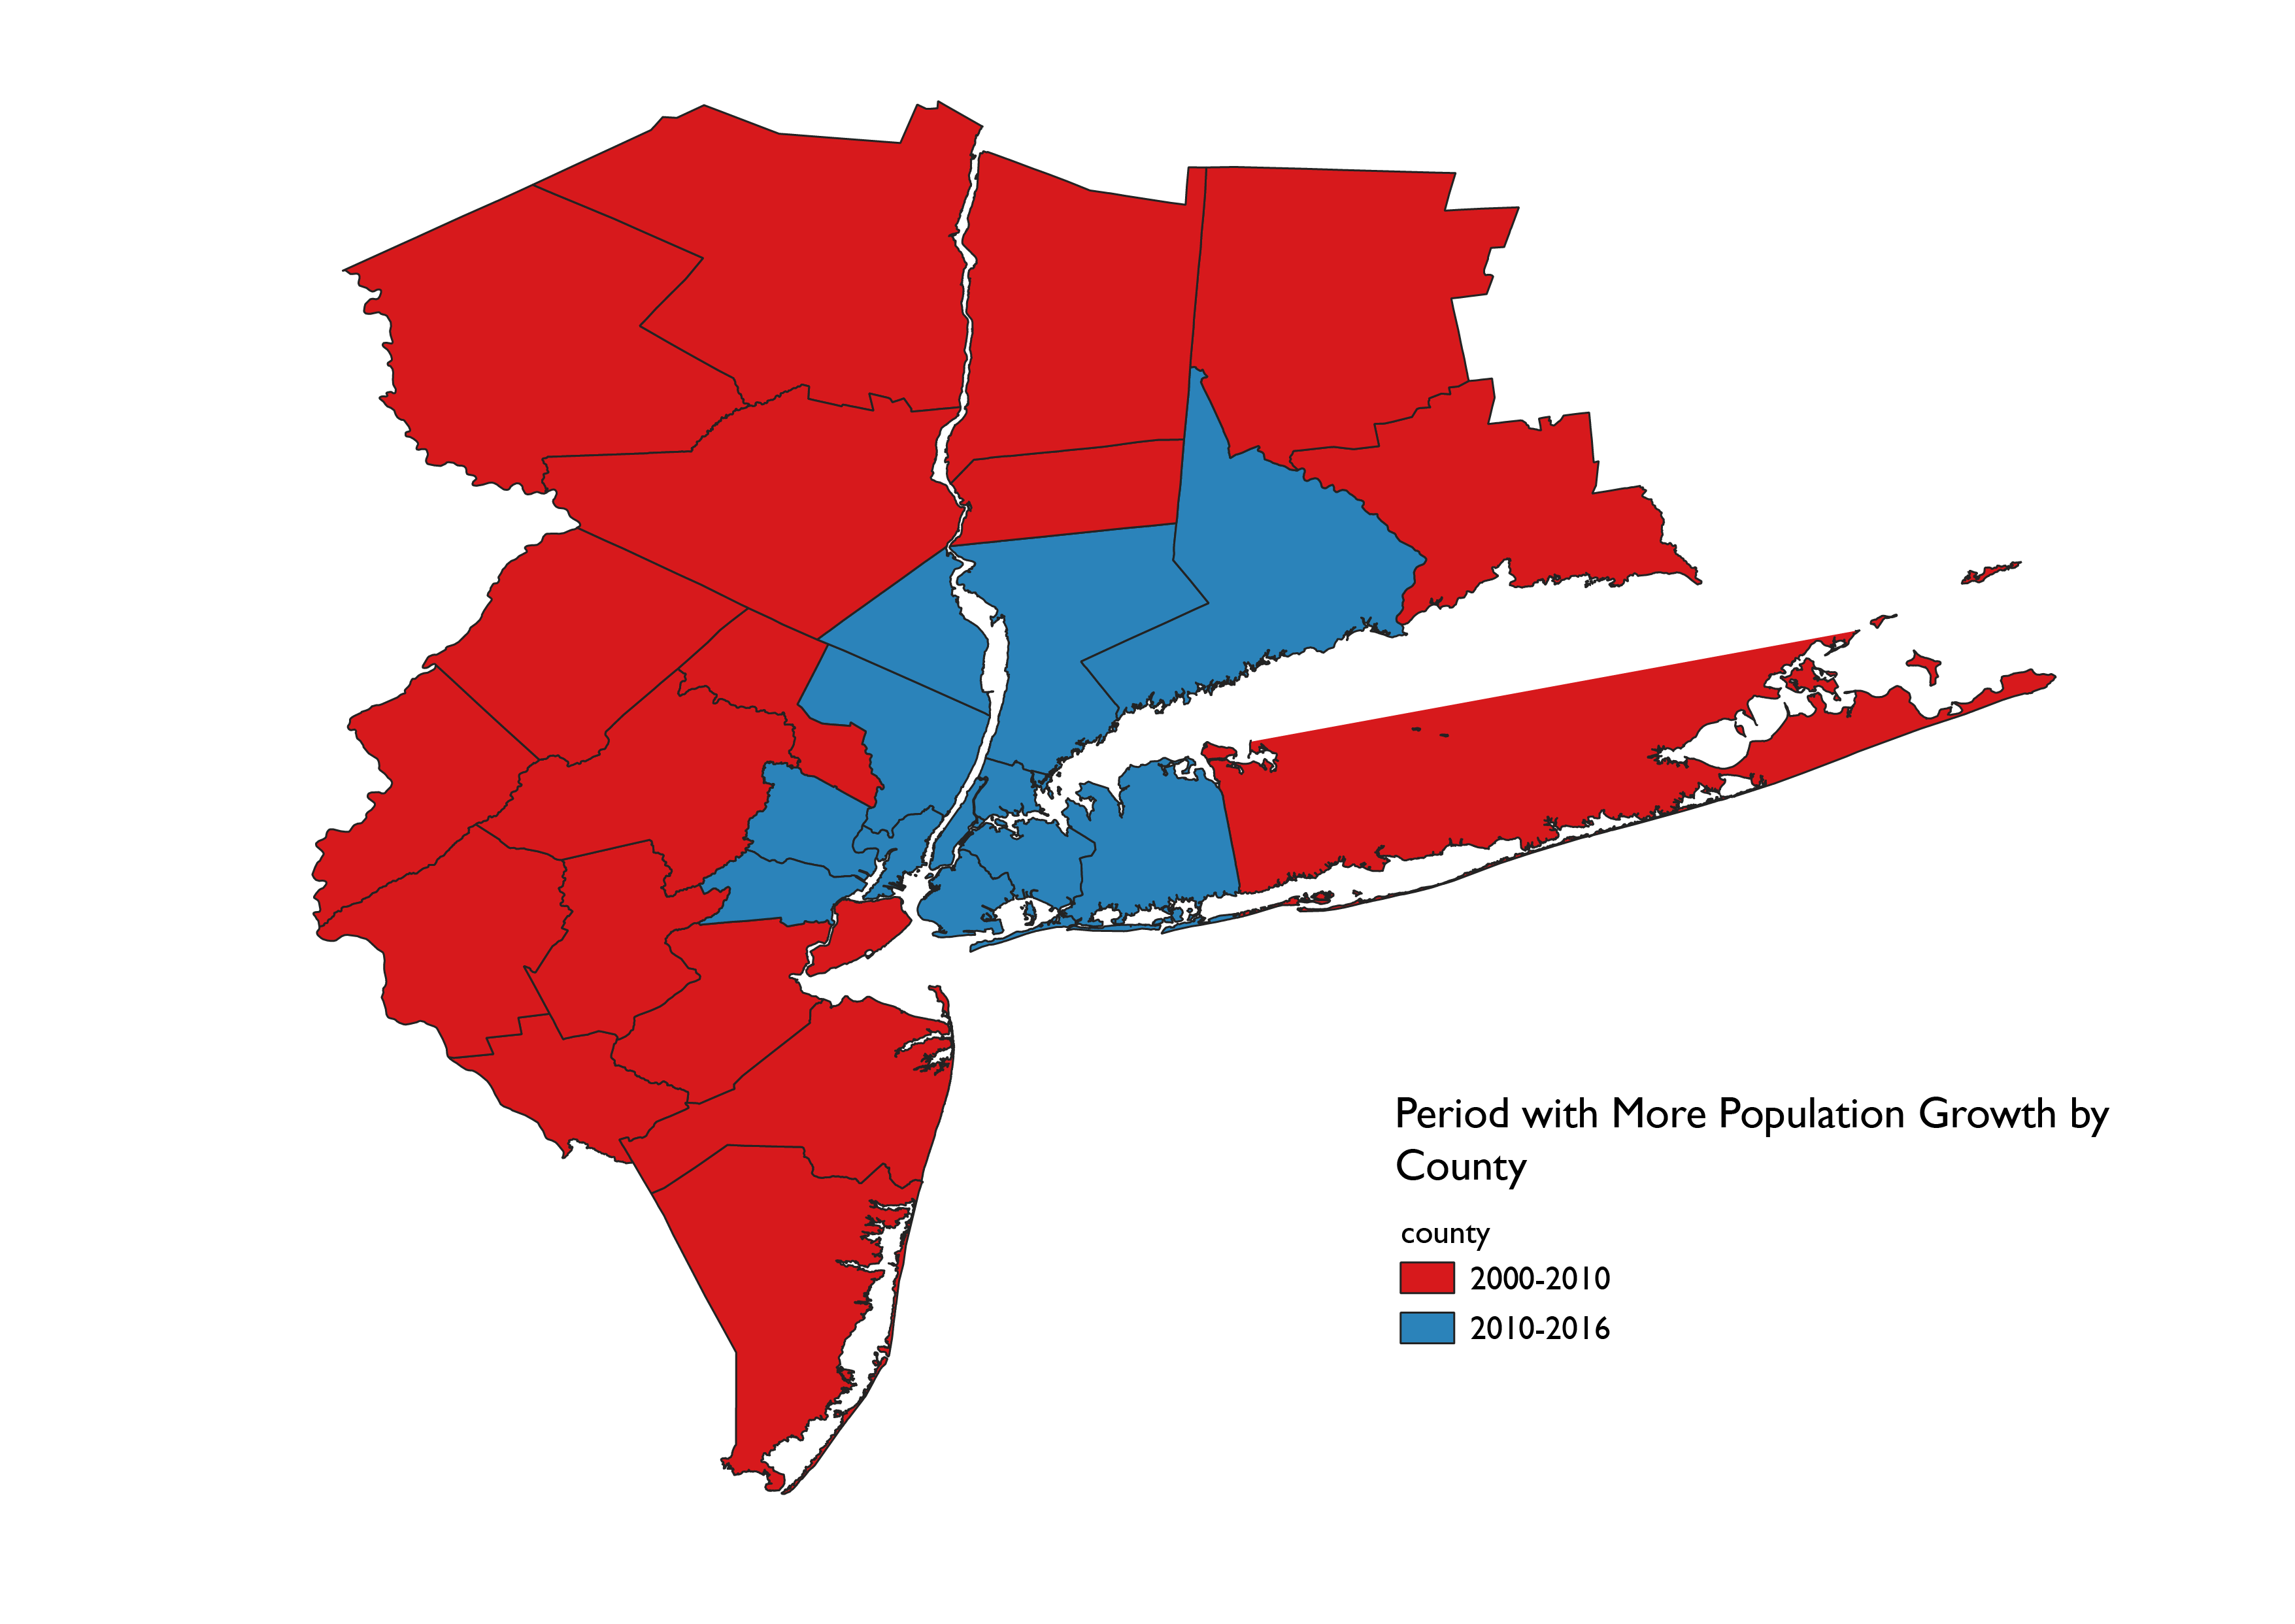
The following Sankey diagram shows the number of counties per region that had greater change in each period.
Sankey Diagram 1
How did the counties' populations change between 2000-2010 and 2010-2016?
To summarize, the central core of the region has seen consistent increase in population between 2000-2010 and 2010-2016. The outer parts of the metro region experienced increases in population during 2000-2010, only to see a decrease during 2010-2016.
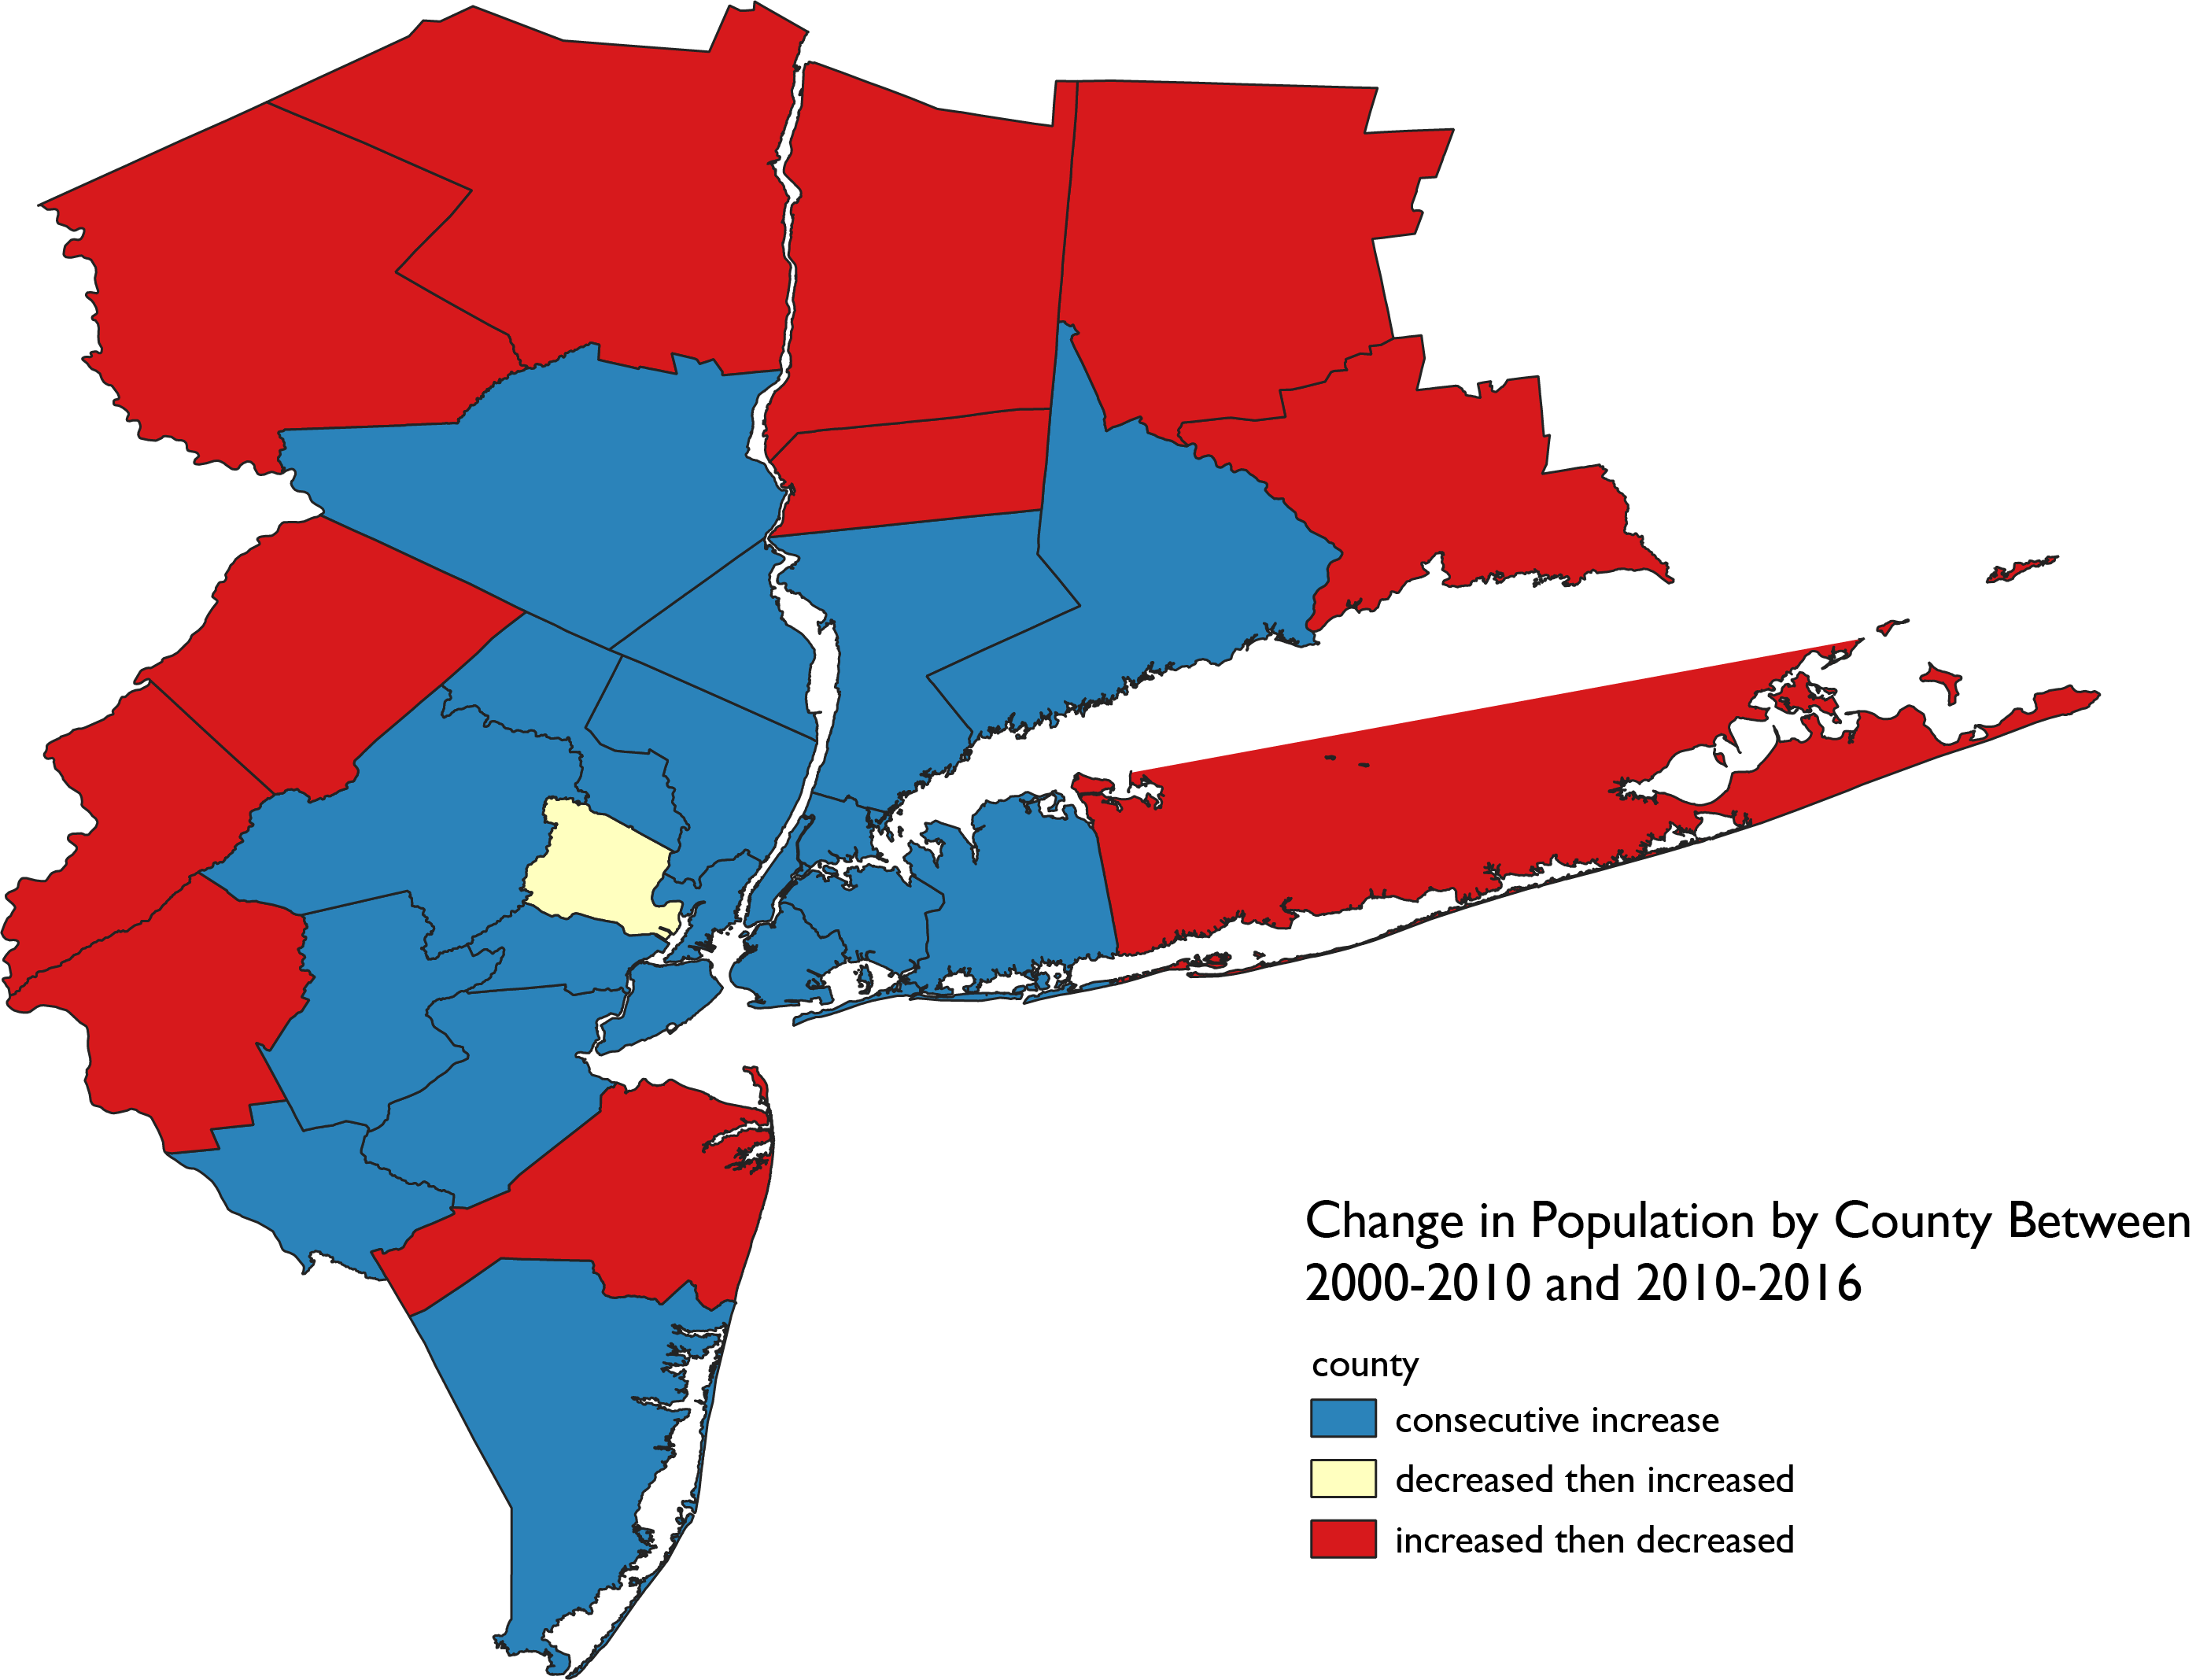
The following Sankey diagram shows how different regions compare between the two periods by number of counties.
Sankey Diagram 2
Further questions
How has the region's population changed in the past, and what projections can we make into the future?
What sort of economic changes are accompanying these population patterns?
Are the outer regions decreasing in economic vitality, or increasing?
How is this population change affecting the housing stock and transit? Are rents and commuter time increasing?
Take me back home...